ABSTRACT
The use of spreadsheets for what-if analyses can be simplified by allowing cell values to be set by small sliders and displayed as micro-graphs. The sliders define a range in which a cell value will be varied, and the graphs illustrate how other cell values vary when the slider-cell has a value in that range. The resulting mode of operation emphasizes interaction between the system and the user in searching for a desirable value of a cell, and also illustrates the stability of that value by showing the value in a context around it.
KEYWORDS
Spreadsheet, dynamic queries, what-if analysis
INTRODUCTION
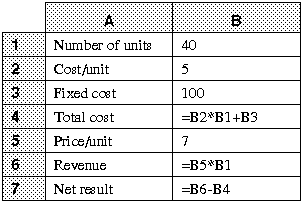
Spreadsheet programs are, together with word processors, by far the most widely used computer programs today. A spreadsheet is made up of cells, which contain text, numeric values, and formulas which describe how a cell value is to be computed from the values of other (which are referenced through their name, given as row and column index). A cell can either display its (computed) value or the formula which defines that value. One important use of spreadsheets is to perform what-if analyses, i.e. to investigate how the value of some cells affects other cell values in the spreadsheet. A typical example (see Figure 1) would be trying to decide the number of units to sell of a product in order to reach break-even. In early spreadsheets this analysis had to be done by trial-and-error methods – manually changing the value of a cell and seeing what the resulting values of other cells would be, and repeating this procedure until the required value for a certain cell was found. Recently, “goal search capabilities” have been added [2], and now provide an automated search for such values. In the example of Figure 1, we can ask for a value of B1 which will give B7 the value 0, and the value 50 for B1 will be found.

FIGURE 1. A simple spreadsheet to calculate the net result of a business. Cells display their defining formulas.
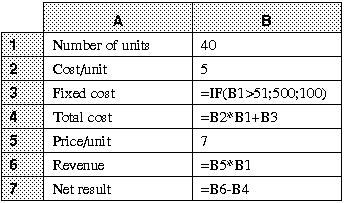
However, a manual, interactive search is in many cases preferable, since it gives the user an intuitive understanding of the relationship between the varying and dependent variables.This can for example help in avoiding the choice of a solution close to a “catastrophic” point – e.g. as in Figure 2 where the solution is close to a sharp decrease in profit (due to a step increase in fixed costs which is described by the conditional formula in cell B3).

FIGURE 2. A spreadsheet with a hidden surprise.
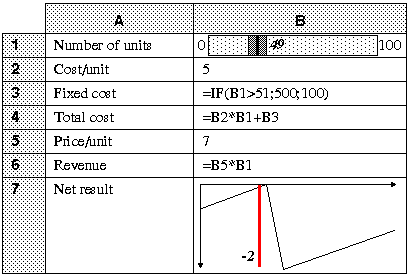
In this article we demonstrate two simple extensions to the traditional spreadsheet model, which provide the necessary means for such manual, dynamic analyses. We call these additions `slidercells’ and `micrographs’. A slidercell is simply a cell which can have its value changed by manipulation of a slider. When a cell is activated as a slider, a range is chosen. This range defines the slidercell’s value range. The current value of the slider is displayed next to its thumbnail, to yield as compact a representation as possible – see Figure 3. The reason we strive for compactness is that both sliders and graphs are ordinary cells, and we wish to be able to view many cells at the same time – this is one of the key ideas behind spreadsheets. A micrograph is a cell which instead of just displaying a value displays a tiny X-Y graph, where the X dimension is the value of an activated slidercell that the micrograph depends on, and the X range is the range of that slider. The Y dimension is the value of the micrograph for each X value, and its range is defined by the range of that cell’s value. The current X value is marked by a vertical line in the micrograph, and the current Y value (i.e. the value of the cell) is also displayed in the graph – see Figure 3. Note that from the graph shown in cell B7 in Figure 3 it is immediately obvious that there is a break-even solution, but also that this is a very unstable solution! With the automatic solver, we got no such information. As computational models become more complex, the usefulness of micrographs increases, since the co-variation of several cell values can be studied simultaneously, as one or several slidercells are being manipulated. The intuition which can be gained from such explorations is particularly helpful in situations where no optimal solution to a problem can be found, and the best possible solution must be chosen by a human.
RELATED WORK
Wilde and Lewis [3] also describe how to extend the spreadsheet model with interactive graphics. The main difference compared to the work presented here is that instead of having a graphical “shell” on top of a spreadsheet model, we suggest simple graphical I/O primitives (sliders and graphs) which replace the conventional, textual representation of a cell in the ordinary spreadsheet. We also emphasize the interactive exploration of cell value dependencies, by introducing the new notion of a potential value range for a cell, and its reflection in the micrographs of other cells. Our initial idea of extending spreadsheets with interactive, graphical I/O devices was inspired by work on dynamic queries [1]. It is interesting to note that whereas “traditional” dynamic queries focus entirely on the exploration of “dead data” stored in conventional data bases, the methods presented here deal with potentially infinite data sets, represented as a number of computational dependencies. Therefore, even if spreadsheets might be the first area where these I/O devices are used, they should also prove useful if and when the dynamic query model is extended to work with, for example, deductive data bases.
CONCLUSIONS AND FUTURE WORK
We feel the ideas reported here indicate new directions for the design of spreadsheet systems. Furthermore, the modular design of modern spreadsheet programs makes it possible to extend existing programs with this kind of functionality. Our next step is to extend some commercial spreadsheet system with the I/O devices presented here.
ACKNOWLEDGEMENTS
Christopher Ahlberg persuaded me to write down these ideas, and commented helpfully on earlier drafts of this paper.
REFERENCES
[1] Ahlberg C., Williamson C., Shneiderman B., Dynamic Queries for Information Exploration: An Implementation and Evaluation. Proceedings ACM CHI `92: Human Factor in Computer Systems, 1992, pages 619-626.
[2] Microsoft Excel 5.0, Users Manual, Microsoft Corporation, 1994.
[3] Wilde N., Lewis C., Spreadsheet-based interactive graphics: from prototype to tool, Proceedings ACM CHI `90, 1990, pages 153-159.

FIGURE 3. A spreadsheet with cell B1 used as a slider cell and cell B7 viewed as a micrograph

